Using PostHog Toolbar (Heatmap)
1/11/2023
Info
In this tutorial, you'll learn about the basics of the PostHog Toolbar, how to enable it for your site and how to access it on your site.
At Murmur, we use PostHog for our data analytics and I've been really happy with it.
I didn't feel the magic until I found the PostHog Toolbar and figured out how to use it (specifically the heatmap feature).
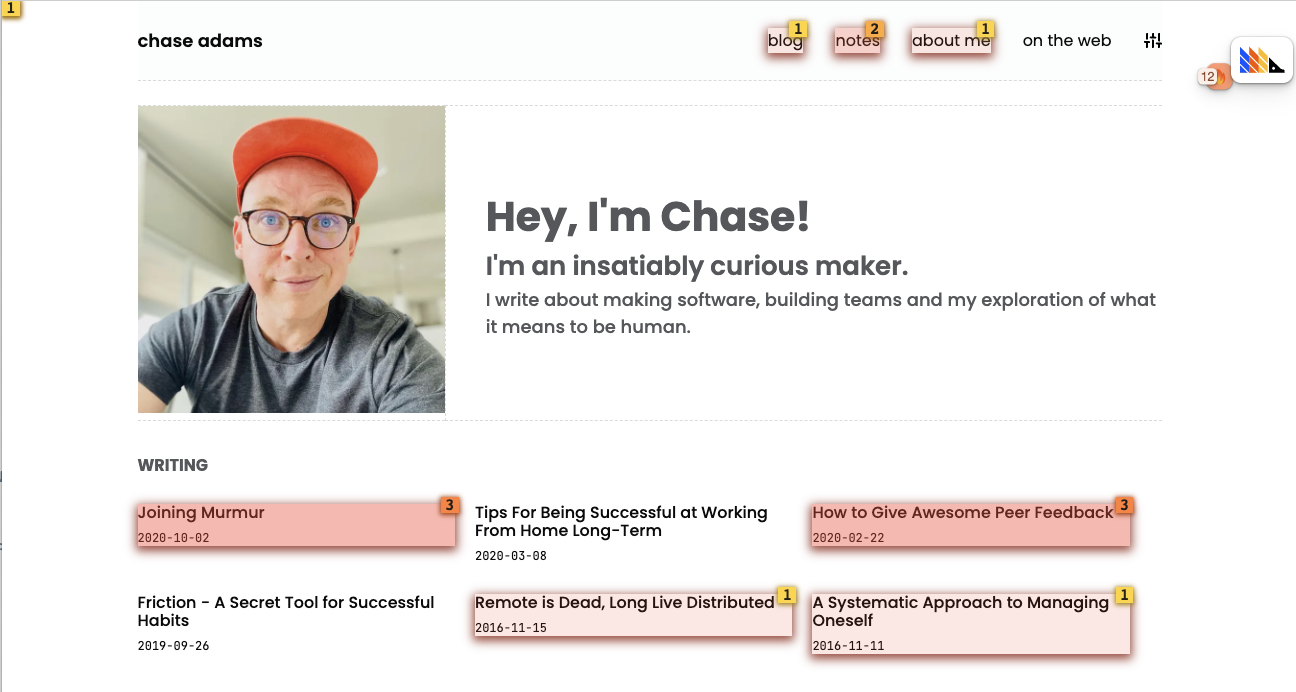
The PostHog Toolbar is a little widget with the PostHog logo on it that shows up on in the corner of your site.
Prerequisites
- PostHog project with a valid domain setup
- Some data for your site
Enable PostHog Toolbar
In the top left corner of PostHog, you should see a Project. If you aren't on the project you want to use the Toolbar for, click the drop menu icon to the right of the project you're in and select the one you want. 1
Once you're in the project that you want to enable the PostHog Toolbar...
- Under Configuration, click Launch Toolbar
- On the Toolbar configuration page, toggle Enable the PostHog toolbar on if it's not already enabled
Add Authorized URL
For PostHog to display your analytics data on your site, you'll need to add an authorized URL for your domain.
To add an authorized URL...
- Under Authorized URLs for Toolbar, click the button that says Add Authorized URL
- Inside of the newly display input, add your URL 2 and click Save.
- Now you'll see that an item has been added for your new URL
Access PostHog Toolbar
Now that you've enabled the Toolbar and authorized it, you can click the Launch button for the URL you authorized.
When you click Launch
Explore The Toolbar
When you click the logo, you'll see a few options fly out:
- Inspect
- Heatmap
- Actions
- Feature Flags
The PostHog Toolbar doesn't start with any of these enabled, so if you want to use one, you have to click the icon to enable it. Enabling it only enables it for the current session, so don't panic if you close the page and re-launch and don't see any Heatmap indicators.
Heatmap
The feature I've used the most so far is the heatmap (shown in the first image in this post).
Heatmap shows you an aggregated view of any autocapture events or manually captured events.
You'll see count indicators anywhere you have clickable elements that have been clicked.
In order to navigate through your site, you'll have to disable the heatmap, click the link or button you want and then re-enable the heatmap.
Summary
In this tutorial you learned how to enable and authorize the PostHog Toolbar for your PostHog Toolbar.
You also learned how to enable the heatmap and what you'll see when you enable it.
Footnotes
-
: When adding a domain, make sure it's using the correct subdomain if you use on (ie, I use https://chaseadamsio.com but if I used https://www.curiouslychase.com, I'd need to make sure it's exactly that URL) ↩